Why Is This Important?
- Being able to identify the pattern on the most appropriate time frame is essential for trading the H&S reversal pattern if you are to be profitable.
- If you view the set-up on too high a time frame you will likely miss trade entry opportunities
- Conversely, if you view it on too low a time frame, then you will see and experience many false signals.
Step 1 : Identify the Start/End of the Pattern.
- The start of the Head & Shoulders (H&S) pattern is the left side of the left shoulder.
- From the left side shoulder anchor point draw a horizontal line to the neckline
- Extend the line to the left until you intersect with the body of a candle – not a wick- this marks candle number 1 of the pattern
- The end of the pattern is the right of the right shoulder where a candle first breaks and closes above/below the neckline
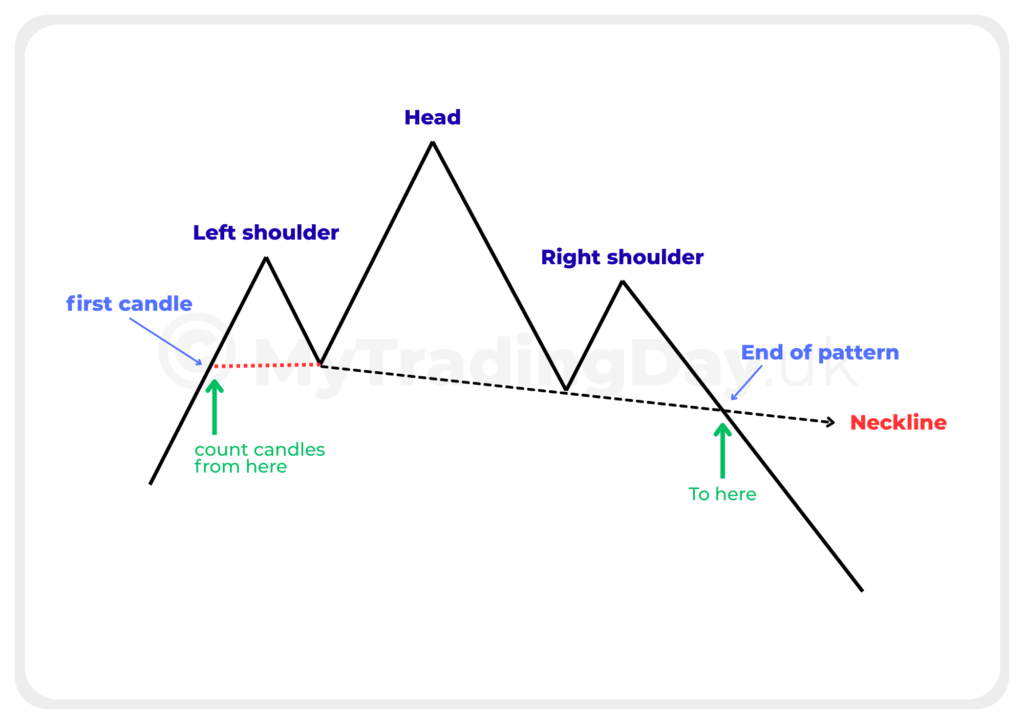
Step 2 : Count the Candles in the Pattern
Count the total number of candles from the first candle of the left shoulder to the end of the pattern where the neckline breaks through the right shoulder of the total pattern. (see above diagram)
Step 3 : Asses & Determine the Time Frame
15 minute or 1 hour chart
The pattern should have a minimum of 30 candles and a maximum of 120 candles. If there are fewer than 30 candles, move to a lower time frame and trade the pattern. If there are more than 120 view and move the to the time frame above. TAKE NOTE… with H&S do not go lower than a 15 MINUTE Time Frame.
The 4 hour chart
On the 4 hour chart you should have a minimum of 30 candles and a maximum of 180 candles. Again as the above, if fewer than 30 candles move to the HOURLY time frame, and if there are more than 180 candles then move to the DAILY time frame.
The Daily Chart
On the DAILY chart there should be a minimum of 30 candles and a maximum of 210 candles. If there re fewer than 30 then move to the 4 HOUR time frame, and if there are more than 210 then you need to move up to the WEEKLY Time Frame
TEST 1 >> The HOURLY Time Frame
In this pattern there are 198 candles between the start and the end of the pattern set-up
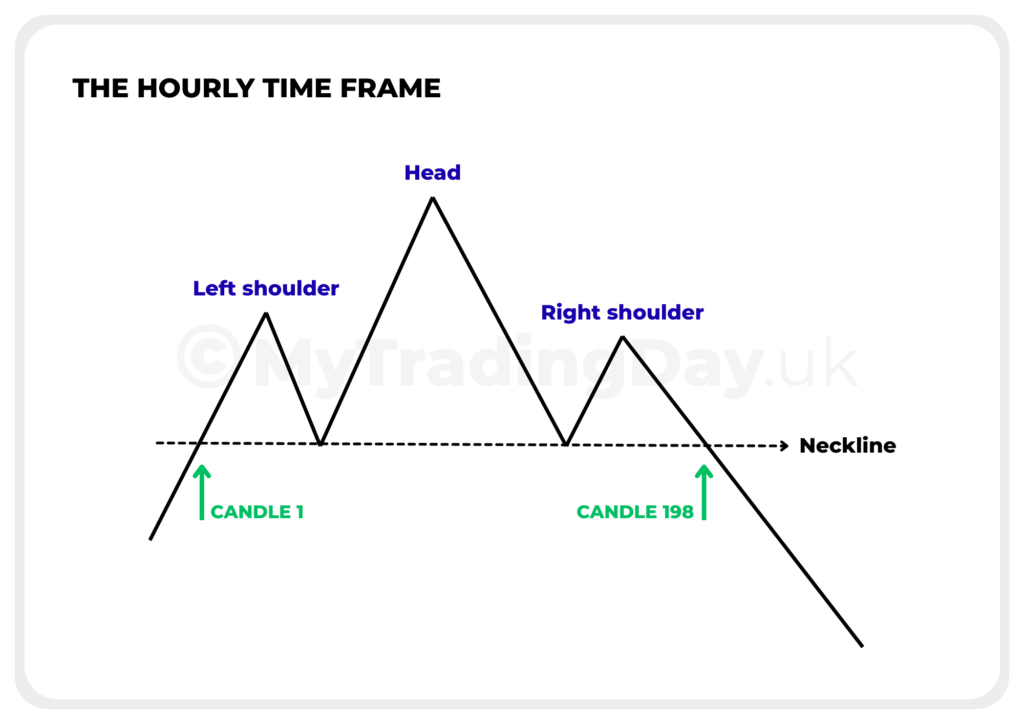
Q: Is this a valid time frame to be on..?
INCORRECT – on the hourly time frame there is a maximum of 120 CANDLES in the pattern, so you would need to move up to the 4 hour time frame to reduce the number of candles in pattern.
CORRECT – because on hourly there should be a minimum of 30 and maximum of 120 candles in H&S reversal pattern. Therefore, you would need to move up to the 4 hour time frame to reduce the number of 198 candles in the pattern.
TEST 2 >> The 4 HOUR Time Frame
In this pattern there are 27 candles between the start and the end of the pattern set-up
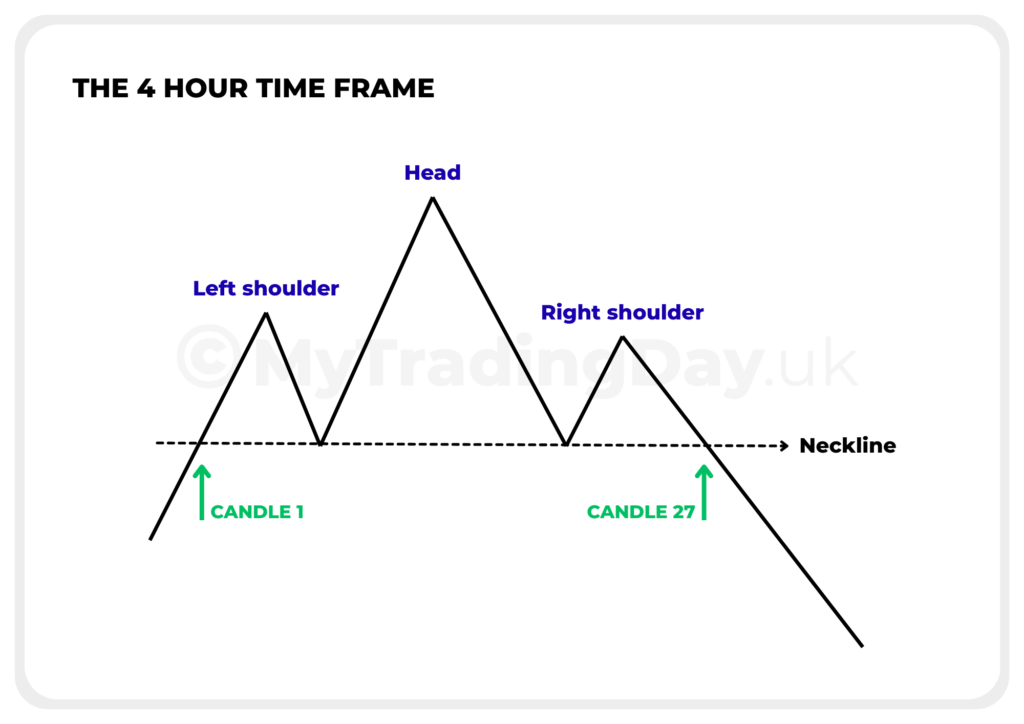
Q: Is this a valid time frame to be on..?
INCORRECT – on the 4 hour time frame you should have a minimum of 30 candles in the pattern, so you would need to move down to the 1 hour time frame to increase the number of candles.
CORRECT – because on a 4 hour chart there should be a minimum of 30 and maximum of 180 candles in the pattern. Therefore, you would need to move down to the 1 hour time frame to increase the number abive 27.
TEST 3 >> The DAILY Time Frame
In this pattern there are 150 candles between the start and the end of the pattern set-up
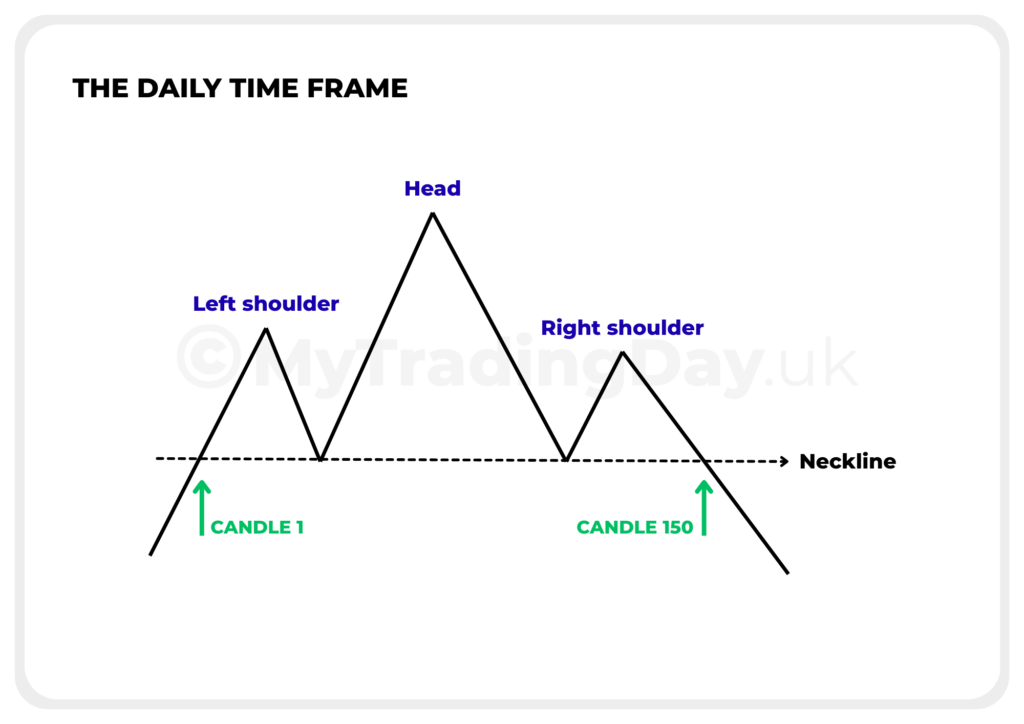
Q: Is this a valid time frame to be on..?
CORRECT – on the daily time frame you can have a maximum of 210 CANDLES in the pattern, so there would be no need to change timeframe.
INCORRECT – Remember that on the DAILY Chart there should be a minimum of 30 and maximum of 210 candles in the pattern. So there would be no need to change the timeframe.
Table of Summary
1. Identify the Start and End of the pattern
The start of the Head & Shoulders (H&S) pattern is the left side of the left shoulder where the body of a candle most recently intersects the extended horizontal line that is drawn from the left anchor of the neckline. The end of the pattern is the right side of the right shoulder where price breaks and closes above or below the neckline.Identify the Start and End of the pattern
2. Count the Candles
Count the total number of candles from the start to the end of the pattern.
3. Assess the Time Frame for 15 Minute or 1 Hour Chart
The pattern should have a minimum of 30 candles and no more than 120 candles. If there are fewer than 30 candles on the HOURLY Chart, then you need to move down onto the 15 MINUTE Time Frame, if there are more than 120 candles then you need to move to the higher Time Frame of 4 hours.
4. Assess the Time Frame for the 4 HOUR Chart
The pattern should have a minimum of 30 candles and no more than 180 candles. If there are fewer than 30 candles, then you need to view the chart on the HOURLY Time Frame, if there are more than 180 candles then you need to move to the DAILY Time Frame.
5. Assess the Time Frame for DAILY Chart
The pattern should have a minimum of 30 candles and no more than 210 candles. If there are fewer than 30 candles, then you need to the 4 HOUR Time Frame, if there are more than 210 candles then you need to move to the WEEKLY Time Frame.